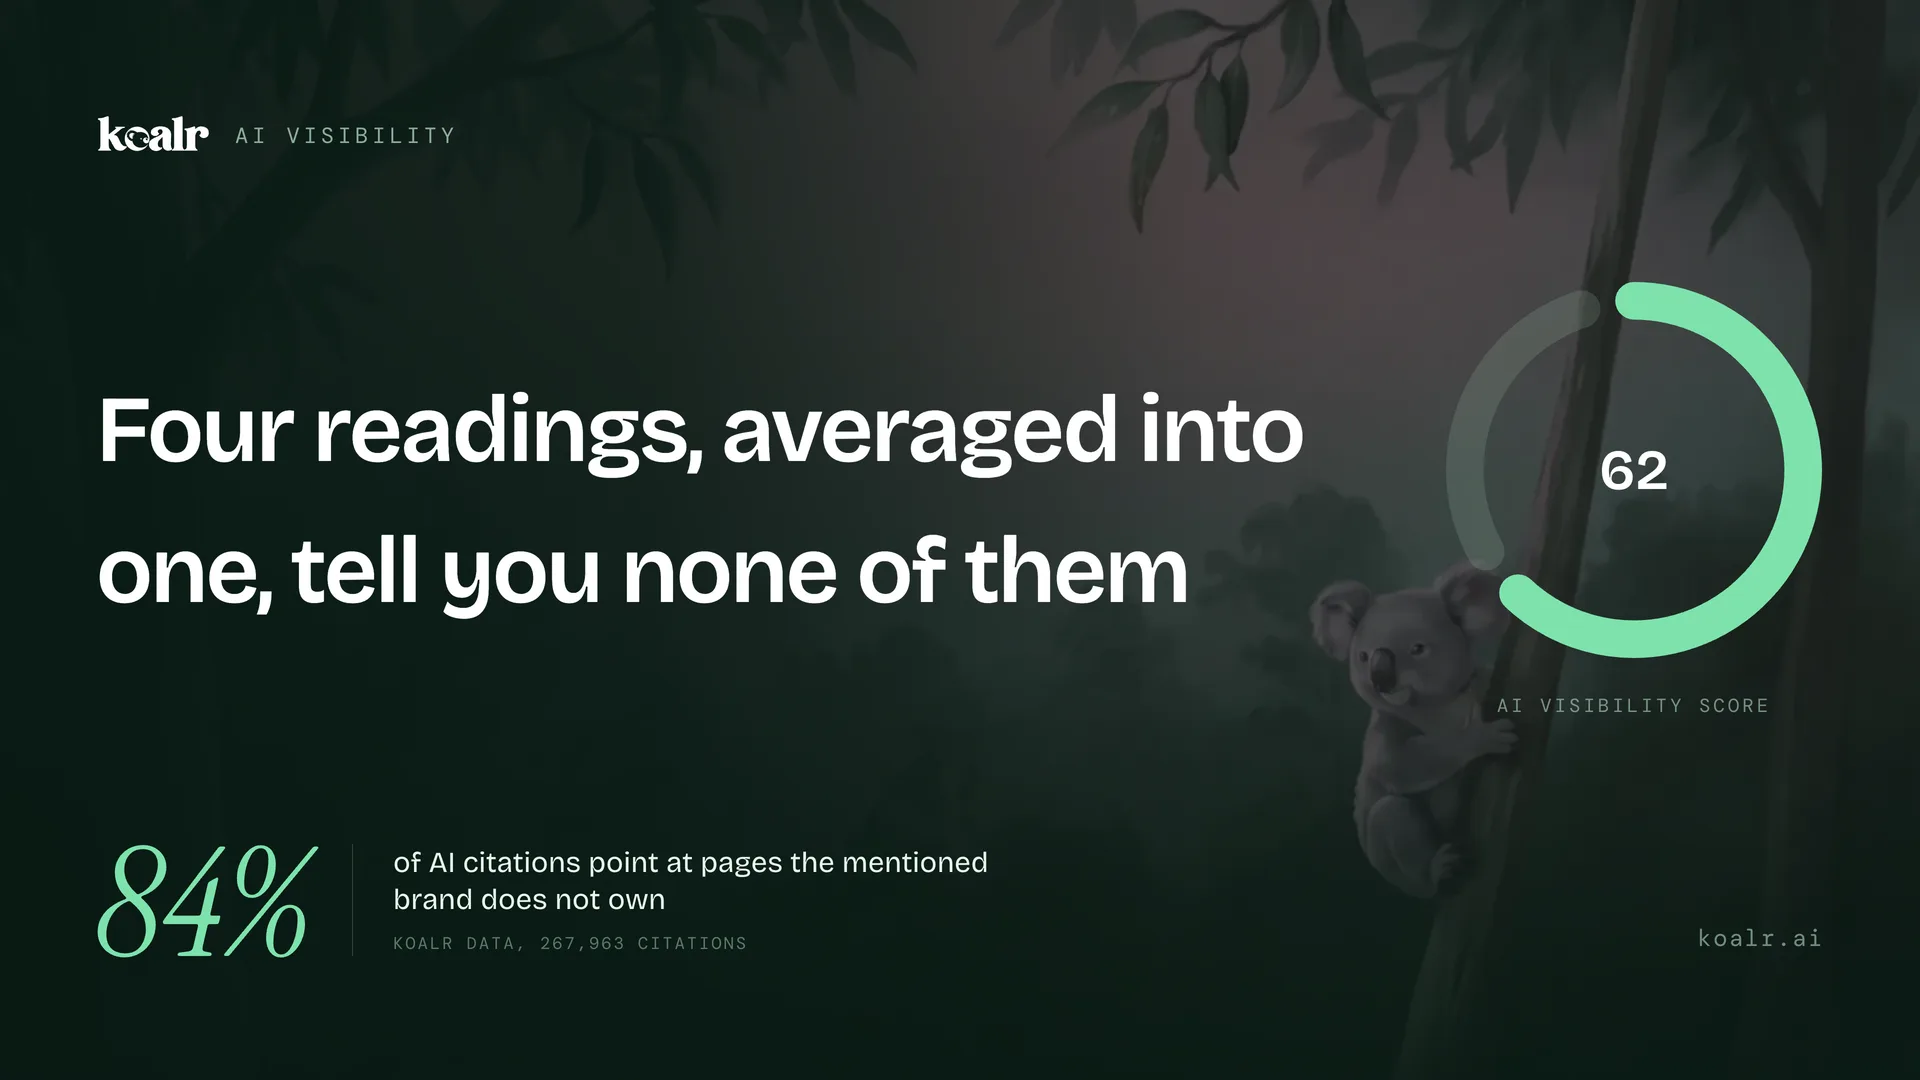
Most AI visibility scores are a blend: a 0 to 100 number that folds together how often engines name you, how prominently, whether they cite your pages, and how you compare to rivals on the same questions. Ours was too. It is not any more. Koalr's AI Visibility Score is now one thing only — how often the AI engines name your brand across the prompts you track, from 0 to 100, shown in-app as the Prompt Visibility Rate. Citations, share of voice and sentiment are still measured, still reported, and no longer stirred into the headline.
This post is the argument for that, because we think the blend is the wrong default and most of the category still ships it.
Buyer asks: “best AI visibility tools for a small marketing team”
For smaller teams, the tools most often recommended are Koalr and two of its competitors, which cover multiple answer engines at accessible price points.
Sources: a rival's roundup post, a Reddit thread
Illustrative example. The brand is named, but every cited source belongs to someone else.
Your brand is named, so mention rate goes up. But not one of the cited sources is yours, so citation rate does not move, and the buyer's next click lands on a competitor's page. A score counting only mentions records this as a win. A blended score records it as a slight win, which is worse: it has an opinion about how much the missing citation matters, it does not tell you it had one, and the two readings that would have shown you the problem have already been averaged together.
The four readings a blended score is made of
A composite score measures four things that behave independently, then weights them into one number. Knowing which of the four is dragging is what tells you what to fix, because the fixes have nothing to do with each other.
| Reading | What it asks | What a low reading means |
|---|---|---|
| Mention rate | On what share of tracked prompts does an engine name you at all? | Buyers in your category are never shown you. A content problem. |
| Prominence | Where in the answer, and how high in any list? | You are an also-ran. A positioning and third-party-proof problem. |
| Citation rate | Does the engine link your page as its source? | Someone else's page is describing you. An off-page problem. |
| Share of voice | How does your mention rate compare to named rivals on identical prompts? | Absolute numbers look fine while you lose ground. A competitive problem. |
The four come apart in practice, and not gently. A brand can hold a 40% mention rate with a 2% citation rate, which means engines know the name but learn about it entirely from other people's pages. A brand can hold a high citation rate with poor prominence, which means its pages are trusted as reference material while a competitor gets the recommendation. Those are two different companies with two different problems, and a blend can hand them the same number.
Which engines should the score cover?
Seven surfaces matter, and they disagree with each other enough that a score from any one of them tells you very little about the rest. Koalr tracks all seven: ChatGPT, Claude, Gemini, Perplexity, Microsoft Copilot, Google AI Overviews and Google AI Mode.
The disagreement is measurable. Across 295,746 citations we looked at which page type each engine prefers to cite:
| Page type | ChatGPT | Copilot | Perplexity | Gemini | AI Mode | AI Overviews |
|---|---|---|---|---|---|---|
| Homepage | 34.1% | 30.0% | 10.9% | 5.6% | 8.2% | 9.3% |
| Product or feature page | 11.0% | 4.0% | 21.2% | 10.5% | 23.7% | 24.4% |
| Pricing page | 14.8% | 12.3% | 24.1% | 4.0% | 21.2% | 22.6% |
| Blog post | 5.2% | 12.1% | 17.3% | 12.8% | 24.0% | 26.1% |
| Question-style page | 7.8% | 3.9% | 19.8% | 7.2% | 27.2% | 29.8% |
Read down the columns and the strategy separates cleanly. ChatGPT takes 34.1% of its citations from homepages and 5.2% from blog posts, so a blog-only programme is close to invisible there. Google's two surfaces take 51% of their citations from question-style pages and 50% from blog paths, so they reward exactly the content ChatGPT ignores.
A tool that only checks ChatGPT and reports a low score is telling you your homepage is weak. It is not telling you anything about your blog.
Why we stopped blending them
The composite is built the same way almost everywhere: a base appearance rate, adjusted by where in the answer the mention lands, then modified by whether a citation was attached and what sentiment the surrounding language carries. We built ours that way too, and shipped it for months.
Three things were wrong with it.
The weights are an opinion nobody voted on. Deciding that a citation is worth a 15% uplift, or that being named third costs you 30% against being named first, is a judgement about your business made by a vendor who has never seen your funnel. It is not measurement. It is measurement wearing a coefficient. And because the coefficients are invisible in the output, you cannot disagree with them — you can only accept the number or ignore it.
Movement stops being attributable. A blended score that falls four points has at least four candidate causes, and the arithmetic that produced it has already destroyed the evidence for which one it was. Every team we watched using a composite ended up doing the same thing: opening the components to find out what happened. If the first move after reading a number is always to take it apart, the number is a step in the way, not a step forward.
The two readings that most need separating get averaged. Mention rate and citation rate come apart hardest, and the gap between them is the single most useful thing in the data — it is the difference between "engines have never heard of you" and "engines know you and learn about you from a competitor's page". A blend narrows that gap by construction. The sentiment adjustment is worse again: an engine that names you while listing three caveats is a positioning problem, and folding it into the same figure as an engine that never named you at all is not summarising, it is discarding.
So the headline is one reading now, and the other three sit beside it.
How the number is calculated now
- 1
Fix a prompt set and hold it
The same real buyer questions every cycle, across every engine. The free scan runs exactly 25; paid plans track from 25 a site on Starter to 40 on Growth and 50 on Business. A changing prompt set makes the trend line meaningless, because you cannot tell a real move from a different question.
- 2
Record presence, position and source
Per prompt, per engine: were you named, how early, and which URL was cited. This per-answer record is the data. Everything downstream is a view of it.
- 3
Count, do not weight
The share of scored answers that name your brand, as a percentage. No position multiplier, no citation bonus, no sentiment adjustment. Prompts that already contain your own brand name are excluded, so a guaranteed mention cannot inflate it.
- 4
Report the other three beside it
Citations, share of voice and sentiment keep their own numbers on the same screen. Four readings you can disagree with individually beats one you can only accept.
Three methodology choices still decide whether the number is worth acting on, and they matter more now than they did, because a rate has nowhere to hide.
Where the prompts came from. Prompts derived from real search and buyer behaviour produce scores that track commercial reality. Prompts invented by the vendor produce a score for questions nobody asks. This is the single largest source of variance between tools.
How many there are. Small prompt sets move with model sampling noise. Any single answer can differ between two runs an hour apart with no change to your site at all, so a handful of prompts gives you a number that jitters. Enough prompts, held constant, averages that out.
When it was measured. Engines update. A score from three months ago describes retrieval behaviour that may no longer exist. A score with no date attached is not a measurement.
Why do two tools give the same brand different scores?
Because they are not measuring the same thing, and none of the differences are bugs. Expect a spread of 15 to 60 percentage points on the same brand in the same week.
| Cause of divergence | Effect on the number |
|---|---|
| Different prompt sets | The largest single cause. Different questions, different answers. |
| Different engine coverage | A tool tracking three engines cannot see the four where you might be strong. |
| Different position weighting | Being named fifth counts almost as much as first in some rubrics, and far less in others. |
| Different citation handling | Some count a mention with no source as a full hit. Others discount it heavily. |
| Different sampling cadence | A daily average and a weekly spot check produce different numbers from identical behaviour. |
| Geography and language | UK-phrased prompts return different sources than US-phrased ones. |
The practical consequence: never compare your score across tools, and never celebrate a jump that coincided with a change to the prompt set. A score is only meaningful against its own history, measured the same way. Comparing your Koalr score to a competitor's Peec score is comparing two different measurements that happen to share a scale.
See where your brand shows up in AI search
Enter your website and get your AI Visibility Score across 7 engines. First score in under 5 minutes, no setup.
How do you establish a baseline worth trending?
The order matters. Most teams start by running prompts, then discover the prompts were wrong and lose their history when they fix them.
| Step | What to do | Why this order |
|---|---|---|
| 1 | Write down the two to four buyer types who actually decide | Prompt phrasing follows from who is asking |
| 2 | Map the questions each asks by purchase stage | Awareness, comparison and evaluation questions behave differently |
| 3 | Fix the prompt set and version it | Changing prompts later resets your trend to zero |
| 4 | Scan all seven engines together | Cross-engine gaps are the finding, and they are invisible one engine at a time |
| 5 | Record per prompt, not just the total | The aggregate cannot tell you which page to write |
| 6 | Re-run on a fixed cadence | Monthly for trend. A single scan is a snapshot, not a signal |
Localise from the start if you sell in the UK. British phrasing pulls different sources than American phrasing for the same question, and a prompt set written in US English will quietly under-report the UK content you have already published.
What actually moves the score?
Two workstreams, on very different clocks. The mistake is sequencing them, because the slow one takes months and only starts when you start it.
On-page, measurable in weeks. Put a direct answer to the buyer's question in the first sentence under each heading, in server-rendered HTML. Many AI crawlers do not execute JavaScript, so a comparison table rendered client-side does not exist from the engine's point of view. Keep URLs short: in our data, pages with 1 to 3 word slugs earn 9.6 citations each at a 48.3% mention rate, against 5.6 citations and 19.5% for slugs of 10 words or more.
Off-page, measurable in months. This is where most of the score actually lives, and it is the part teams underinvest in. Across the 267,963 citations in our earlier off-page study, 84% pointed at pages the mentioned brand does not own.
That directory figure is the one that changes plans. Sorted by how reliably a citation turns into an engine actually naming you:
| Source type | Citations | Mention rate |
|---|---|---|
| Reference and wiki-like | 7,047 | 65.1% |
| Directory | 19,068 | 64.6% |
| Review site | 4,211 | 62.8% |
| Marketplace | 8,780 | 57.7% |
| Your own website | 229,651 | 36.6% |
| 2,794 | 37.7% | |
| Blog | 1,619 | 5.2% |
Directories, review sites and marketplaces convert citations into mentions at roughly 1.8 times the rate of your own website and 12 times the rate of a blog post. A G2 or Capterra listing does more for a visibility score than several months of blog output, and it is a one-week job.
This is not an argument against publishing. It is an argument against expecting the blog alone to move a number whose biggest input is other people's pages.
How long should each change take to show up?
Setting the expectation correctly is what stops a programme being cancelled in month two.
| Change | Realistic lag | What you should see first |
|---|---|---|
| Fixing a blocked crawler | Days to 2 weeks | Citations appear where there were none |
| Adding direct answers under headings | 2 to 4 weeks | Prominence improves before mention rate does |
| Shortening URLs on new pages | Next crawl cycle | Applies to new pages, not retrospectively |
| A new directory or review listing | 4 to 8 weeks | Mention rate moves on comparison prompts |
| Earned editorial coverage | 3 to 6 months | Share of voice, the slowest and most durable component |
Measure each against the specific prompts the change was meant to affect, not the headline score. Cluster-level movement is attributable. Headline movement is too noisy to tell you anything about a single page.
Key takeaways
| Point | Details |
|---|---|
| The score is a smoke alarm | It tells you whether you have a problem. The per-prompt detail underneath tells you which page to write. |
| We retired the blend | The headline is now one rate: the share of tracked answers naming you. Citations, share of voice and sentiment are reported beside it, never inside it. |
| Four readings, four different fixes | Mention rate, prominence, citation rate and share of voice come apart. Read them separately, and diagnose which is low before acting. |
| Engines disagree structurally | ChatGPT takes 34.1% of citations from homepages and 5.2% from blogs. Google's surfaces are close to the reverse. |
| Never compare across tools | A 15 to 60 point spread between vendors on the same brand is normal. Compare a score only to its own history. |
| Off-page carries most of the weight | 84% of citations point at pages you do not own. Directories convert at 64.6%, blogs at 5.2%. |
| Run both clocks at once | On-page shows in weeks, earned coverage in months. Sequencing them wastes the slow one. |
A practitioner's view on what the number is worth
I spent a decade signing off marketing budgets before I worked on this, so my first question about any new metric is what decision it changes. For an AI visibility score the honest answer is that it changes a lot in month one and very little by month four. In month one it is genuinely diagnostic: you find out whether engines know you exist, and that reframes the plan. By month four you are watching a line move two points and building a story about why, which is not analysis, it is decoration.
So my rule is that the headline is a reporting artefact and the prompt cluster is the working unit. I almost never open the number first. I open the list of prompts where a competitor is named and we are not, because that list is a content brief that writes itself and the score is just a lagging summary of how well we worked through it. Retiring the blend was the version of that rule the product could enforce on its own, rather than one I had to keep reminding people of.
The mistake I made early was treating a low citation rate as a content quality problem, which is the expensive way to read it. It is usually a distribution problem wearing a content costume. We funded page improvements that were not the constraint, when the real one was that almost nobody else on the internet was describing us, so engines had nothing to cite except our own claims about ourselves. The 84% figure is what changed my mind, and it should probably change yours: most of what an engine knows about your brand, it learned somewhere you do not control.
The uncomfortable part, if you are the person defending the budget, is that the work which moves the number is the work that reports worst. Publishing is visible and attributable. Getting listed, reviewed and written about by other people is slow, lumpy and hard to put in a monthly deck. It is still where the number moves, and pretending otherwise just means funding the wrong half for longer.
Where Koalr fits
Koalr runs your tracked buyer prompts from your category across all seven engines — 25 a site on Starter, 40 on Growth, 50 on Business — and returns an AI Visibility Score from 0 to 100: the share of those answers that name you, and nothing else folded in. The per-answer record sits behind it.
The parts that matter for the workflow above: Prompt Explorer shows exactly which questions name you and which name a rival, Sources ranks the domains and URLs the engines actually cited in your category, Competitors lines your score up against the brands appearing beside you, and GEO Audit scores how readable your pages are to a machine that does not run JavaScript. Actions turns each gap into a task rather than a chart.
Plans start at £79 ($99, €89) a month with a 7-day free trial, and the free scan returns a baseline across all seven engines before you pay anything. If the scan shows a category where rivals own every answer, that is the finding, and it changes the plan more than any feature list will. Questions about your score go to hello@koalr.ai.
Frequently asked questions
Not in Koalr, not any more. It is a single rate: of the AI answers scored against your tracked prompts, the share in which your brand is named, from 0 to 100. Prompts that already contain your brand name are excluded so a guaranteed mention cannot inflate it. Citations, share of voice and sentiment are measured and reported alongside it, never folded in. Most other tools in the category still publish a blended figure, which is one reason the same brand scores differently on two of them in the same week.
Sources
- Which pages do AI engines cite when they mention your brand? (Koalr). Covers the per-page-type citation breakdown behind the engine table above, from the same dataset. Useful if you need to decide which page to fix first.
- What is generative engine optimisation (GEO)? (Koalr). Covers the underlying discipline: entity definitions, extractable answers and schema. Read this if the score diagnosis points at on-page work.
- How to get cited by AI engines through content you do not own (Koalr). Covers the off-page workstream in detail, which is where 84% of citations originate. The slow lever, and the one that matters most.
- How to find out which AI engines are citing your competitors instead of you (Koalr). Covers turning a share-of-voice gap into a specific content brief, which is the working unit described above.