

Most AI visibility reports are one number and a screenshot. A score went up or down, a few quotes got pasted underneath, and the client is left to guess what to do about it. A report that only counts appearances hides the part that matters: which pages earned those appearances, and what to publish next to earn more.
What is an AI visibility report?
An AI visibility report is a periodic summary of how often and how favourably AI engines name a brand when answering real buyer questions, built to be handed to a client or a leadership team who did not run the tracking themselves. It differs from a dashboard in one respect: a dashboard is for the person doing the work, a report is for the person deciding whether the work is paying off.
That distinction gets lost constantly. Agencies in particular default to exporting the dashboard and calling it a report, which produces a document full of numbers the reader cannot act on without asking someone to explain it first.
What should an AI visibility report include?
A report earns its place on someone's desk by answering four questions in order: where do we stand, what changed, why did it change, and what happens next. Skip the third question and the report reads as a scoreboard. Skip the fourth and it reads as an audit nobody asked for.
The sections a client-facing report needs
- Current score and the trend line, not just this month's number
- Mention rate versus citation rate, shown separately per engine
- The specific pages that earned citations this period
- A source-type breakdown: which kinds of third-party pages are doing the work
- The gap list: prompts where a competitor is named and the client is not
- One action tied to each gap, not a general recommendation to publish more
The mention-versus-citation split matters more than most reports give it credit for. A brand can hold a strong citation rate while a competitor holds the mention rate on the same prompts, which means engines trust the brand's pages as reference material without ever recommending the brand itself. A single blended score hides that entirely.
Buyer asks: “what should a monthly AI visibility report actually contain”
A useful report separates the headline score from its drivers: show the trend, name the pages and sources that earned citations this period, break results out by engine rather than blending them, and pair every gap with a specific next step. A report that only shows a number going up or down gives the reader nothing to act on.
Notice the answer assumes the reader already has a tracking tool in place. It describes what good output looks like, not how to produce it, which is exactly the gap a report template has to close.
Which sources should a report weight?
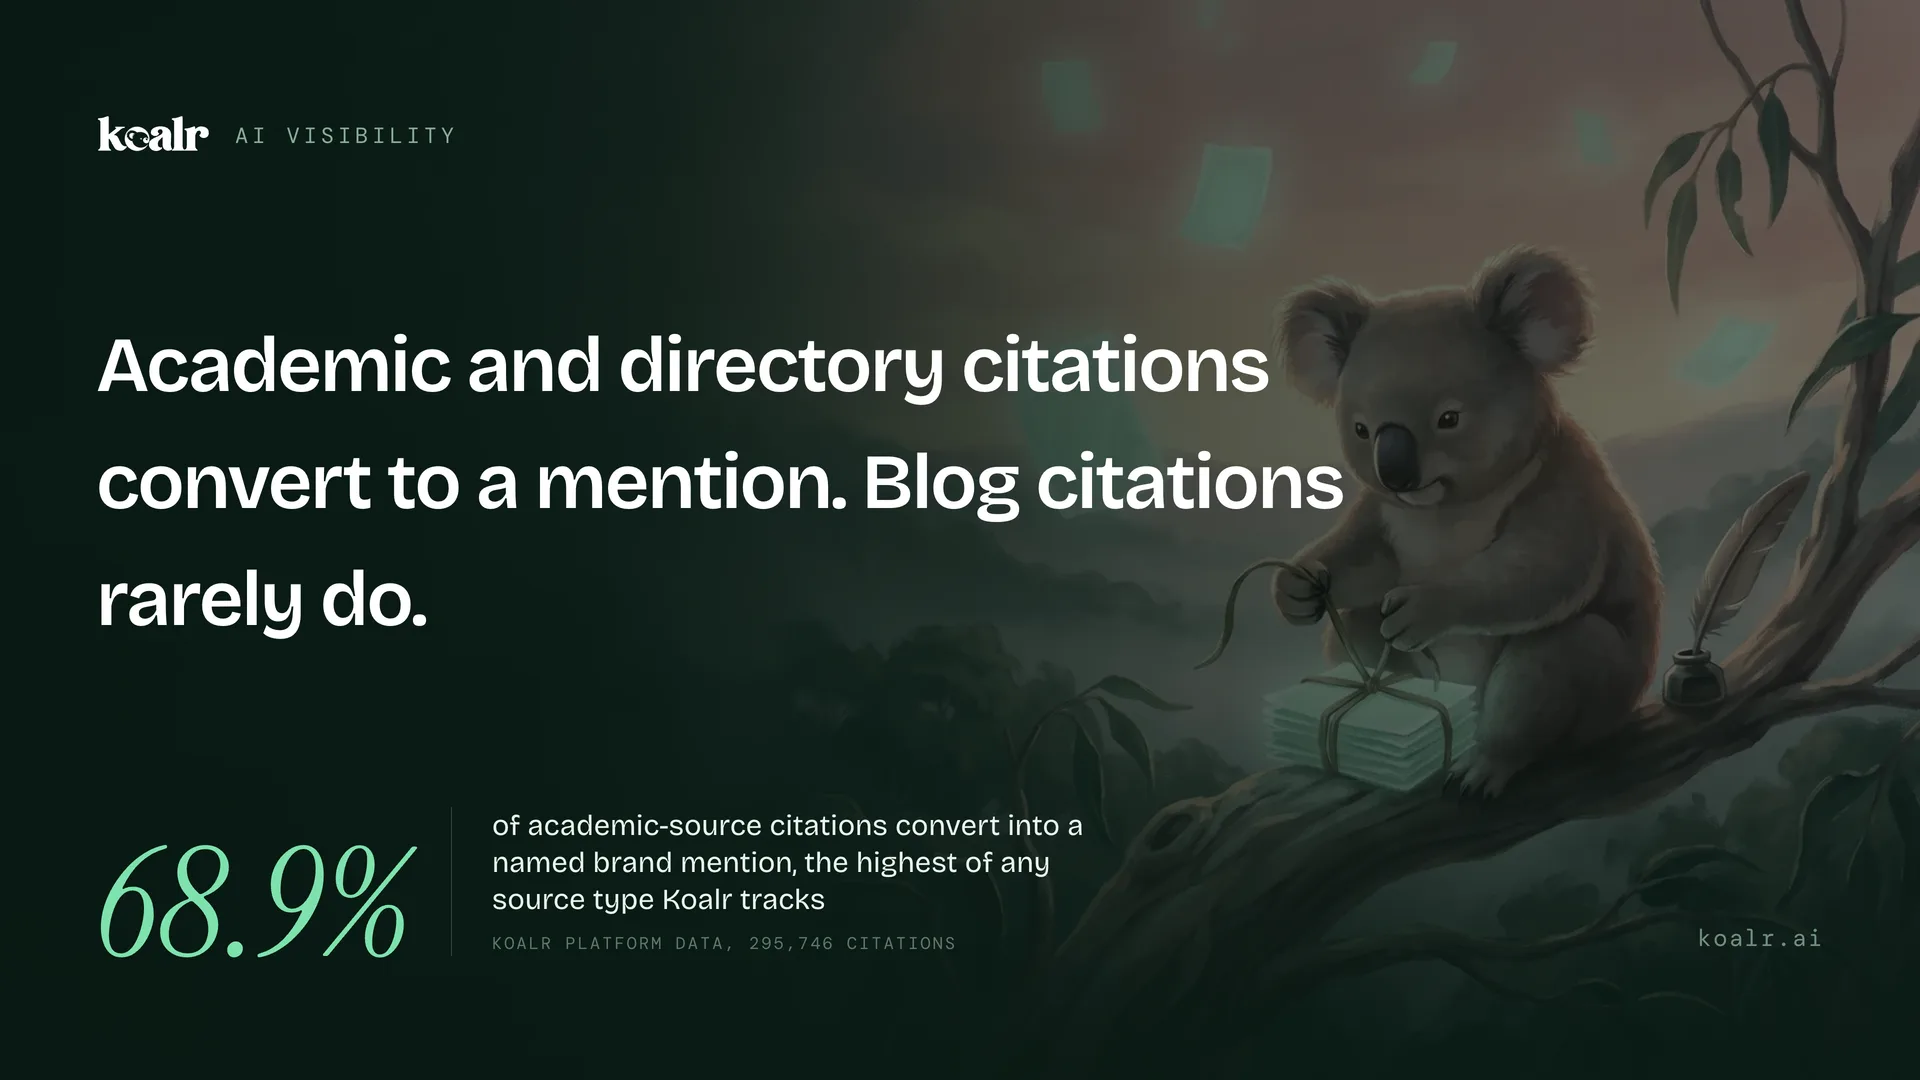
Not all citations are worth the same amount of attention, and a report that treats them as interchangeable buries the finding that would change what a client publishes next. Across Koalr's tracked data, how often a citation converts into a named brand mention depends heavily on where it came from.
| Source type | Citations converting to a mention |
|---|---|
| Academic | 68.9% |
| Reference (wiki-like) | 65.1% |
| Directory | 64.6% |
| Review site | 62.8% |
| Marketplace | 57.7% |
| Forum | 39.0% |
| 37.7% | |
| Company website | 36.6% |
| Social media | 31.3% |
| Comparison site | 30.1% |
| Government | 24.7% |
| News | 16.4% |
| Video | 15.8% |
| Blog | 5.2% |
A report that lists ten new citations without this breakdown treats a Reddit thread and a directory listing as equally valuable, when one converts to a mention roughly ten times more often than the other. If a client's citation count went up this month entirely on blog pickups, the score will barely move, and the report should say why rather than let the reader assume the tracking is broken.
See where your brand shows up in AI search
Enter your website and get your AI Visibility Score across 7 engines. First score in under 5 minutes, no setup.
How often should a report go out?
Monthly is the right default for anything a client or a leadership team reads. AI answers move between sessions and accounts, so a single check any given week is a snapshot, and a client-facing report built on snapshots reads as noisy rather than informative. Reserve a weekly cadence for whoever runs the programme; the person deciding budget does not need to see week-to-week wobble that resolves itself by the following check.
Sending more often is not neutral. A report that shows up in someone's inbox every week and moves half a point either way trains the reader to stop opening it, which is the outcome the whole exercise exists to prevent.
What makes a report worth reading
The mistake I see most often is a report that repeats the same three sections every month because the format was built once and never revisited. By month four the client has learned they can skim the header, glance at the score and delete it, and the programme loses its best feedback loop right when it should be proving its worth.
The rule I use: every report includes at least one thing that was not in the previous one, even if it is small, a new competitor showing up on a prompt that used to be uncontested, or a source type the client had never been cited on before. If nothing changed enough to say something new, that itself is worth one honest line rather than a repeat of last month's paragraph with updated numbers.
Where Koalr fits
Koalr builds the score, the mention-versus-citation split and the source breakdown above automatically from your tracked buyer prompts (25 per site on Starter, up to 50 on Business) run across all seven tracked engines: ChatGPT, Claude, Gemini, Perplexity, Microsoft Copilot, Google AI Overviews and Google AI Mode. Agencies use the multi-brand dashboard to generate a branded report per client rather than building one by hand each month, and in-house teams use the same report to show leadership what changed and why. Plans start at £79 ($99, €89) a month with a 7-day free trial, every engine included from the first scan.
FAQ
Frequently asked questions
At minimum: the current score and its trend, mention rate and citation rate shown separately per engine, the specific pages that earned citations this period, a breakdown of which source types those citations came from, and a gap list of prompts where a competitor is named and the client is not, each paired with a specific next action.
Sources
- Koalr platform data, 295,746 citations across 23 tracked brands: the source-type conversion table above, from the same dataset the AI Visibility Score is built on.
- What an AI visibility score measures: what the 0 to 100 figure a report leads with counts, and why Koalr took the other three readings back out of it.
- Brand mentions in AI answers decide the shortlist: the four states a mention falls into, useful detail for the gap-list section above.
- Getting cited through third-party content: why off-site sources carry most of the weight the table above measures.
- AI visibility tools for agencies: where white-label, multi-brand reporting fits an agency's client roster.